The article was originally published on 22.04.2019, before Uber IPO.
Author: Ilya Pestov, startup hunter, analyst, bot evangelist. Ex-CMO at Statsbot.
On the 11th of April, Uber published its IPO prospectus. The range of stock prices has not yet been announced, but according to rumors, the company awaits to get $100 billion evaluation and is going to attract an additional $10 billion. I wanted to figure out what was behind these figures, as I did with Lyft back in March. Does it really make sense?

The Epigraph
Uber is a business that covers six continents, more than 700 cities and has MAU of 91 million. Uber paid out $78 billion to its drivers by 2019. The scale of the company and its role in the economy cannot fail to impress, but their prospectus partly looks like “the most ambitious ICO” white paper.
Dara Khosrowshahi states that Uber covers 1% of all the miles traveled around the globe, and the authors (throughout the document) speak about the company’s future through the prism of SAM and TAM. They basically took trillions of miles, all the existing transport passes to serve the needs of humanity, estimated it at trillions of dollars and called it their market. See details in the glossary and on page 167.
«In particular, we believe many millennials in markets we serve choose not to get a driver’s license, or choose to delay or choose not to buy a car, and instead opt to use our Personal Mobility offering.»
In addition to the Serviceable Addressable Market and Total Addressable Market, they very gracefully popularize the concept of Personal Mobility. They say that people do not need personal transport these days, what they need is personal mobility, and Uber is ready to satisfy it in full. And I understand: such epoch-making positioning is trending nowadays. Indeed, I was most surprised when Reed Hastings named Fortnite and sleep (literally) among the primary competitors. Not like he did project Netflix into the mattress market, but still impressive.
The last thing that surprised me in that prospectus was the repeated mention of the LGBT abbreviation. I can’t say I have seen and studied many S-1 docs in my life, but I have not seen anything like this. Apparently, the Kalanick incident is significant so far, and Uber is still trying, with all its might, to build an image of the most tolerant/inclusive organization on the market.
Ok, let’s move on to actual numbers.
On the Surface
Uber had $14.845 billion of investment, but now the company has only $7.385 billion, and a deficit of total stockholders’ equity. In other words, Uber did not increase its value with attracted money but reduced it.
For comparison, there is an example of a Facebook IPO. Zuckerberg’s social network attracted $2.3 billion, and their total stockholders ‘equity before the IPO was $4.9 billion. So Facebook has become bigger than investors’ money. Uber? Well… Facebook went for IPO to increase the value growth, Uber — to survive.
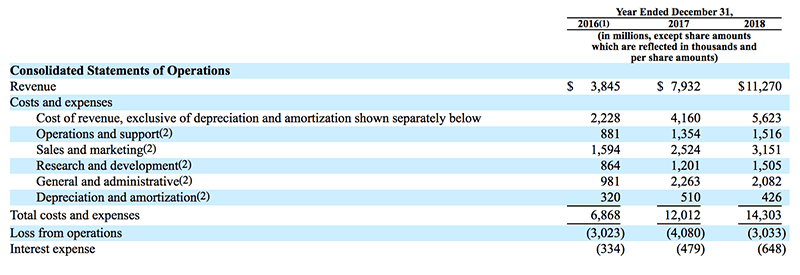
Many who read the latest news about Uber, heard that after two years of net loss, 2018 became profitable for the company, and it managed to earn almost a billion dollars.
However, this happened only due to the deals with Yandex and Grab. And if you take a look at the business activity indicator — it’s negative and amounts $3.033 million. Therefore, I looked at the ratio of income and expenses to the total value of orders in its dynamics.

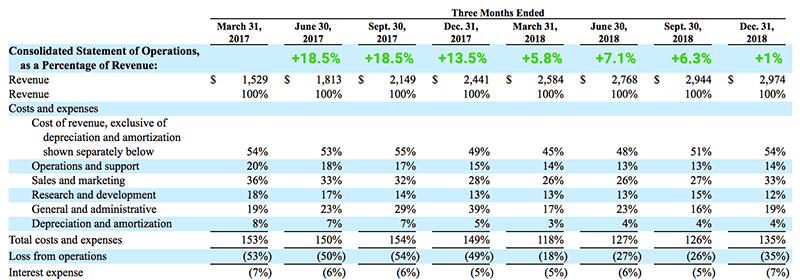
Page 18 of the prospectus
I apologize for being too lazy to provide the data in a proper form (I’m really used to using Sublime). I think everything is clear without any notes, except for maybe one thing — the percentile change of the corresponding metric from year to year is what’s in parentheses.
We see that the difference between income and expenses is decreasing. And it seems that at the current rate, the largest taxi aggregator will take a year and a half to finally set foot on a path of profit.
By the way, positionally, Uber in 2018 looks much better than Lyft. However, reducing costs and making a profit are completely different tasks. Uber is still losing money, but what is the margin?

Page 21 of the official document
Contribution Margin: revenue minus the direct costs of production (see the glossary to learn more). Uber also highlights the contribution margin value for its core business (cabs and foods). Corporate services, freight services, and others are not accounted here (for example, Uber Health). The document on the SEC website illustrates the origin of the contribution profit very well.

Page 99 of the prospectus
We are going to focus on the potential possibility of a situation in which the difference between income and expenditure will be greater than zero. Obviously, Uber is expanding its business geography and is spending huge bucks on its development. But what’s important is to separate the existing business from the investment in the future. Just look at the contribution margin, indicating the effectiveness of the business model.
Deep Waters
In 2017, the contribution margin increased from -23% to 0%. And in 2018, Uber showed a contribution margin of 9%. Pay attention to how brazenly Uber manipulates this indicator. They derive marginality from adjusted revenue, and not from the total revenue for the core business. And it turns out that the smaller the adjusted revenue, the greater the margin.
And the adjusted revenue is always less because the costs of bonuses and referral rewards to drivers are deducted from it. But why? This is the need for retaining their drivers, while under the harsh conditions. I paid a lot of attention in my Lyft articles to how costly searching for new taxi drivers is.
I’ll tell you straight: until the entire Uber transport began a large-scale transition to drones, the numbers cannot be “rearranged” the way described above.
Back to the margin. It turns out that after the correct calculation, the contribution margin is 8%. However, the operating margin for the same period is -26.9%.
«The business model shows we will earn 8 cents from every dollar, but the Uber business model is trying to show us every investment dollar gives 73 cents.»
A vigilant reader will surely reproach me for inaccuracies. After all, I compared the core platform contribution margin and operation margin across all activities of Uber. However, the share of core business in total revenues is 96.7%, and we are not aware of the indirect costs of the core platform, which is why you can’t make an exact comparison by default.
The difference in the surplus model and the deficit of operating activities is impressive. But does this mean that if Uber stops investing money in growth, then it will become profitable? To answer this question you need to understand the costs structure and understand which costs are direct, and which are indirect.
Only their accountants know what exactly “stands” behind each section. In general, these concepts are individual for each specific company. For example, the cost of the Internet connection for a tech company should be in the cost of revenue, while it must be in operation and support for some confectionery factory. Here is a “sketch” of what the expenses may relate to (although all the details are on page 124 of the prospectus):
- Cost of revenue — all expenses incurred during the sale (servers, electricity, traffic, transaction fees, coupons and discounts, salaries, etc).
- Operations and support — the cost of maintenance (system improvement, repair, Internet connection, telephony, staff training, licensed software products, user support and much more).
- Research and development — simply research & development costs.
- Sales and marketing — advertising costs, marketing, and sales teams salaries.
- General and administrative — salaries paid to managers, accountants and lawyers; auditing and consulting services; rent, insurance payments, and expendable materials.
Now we need to compare the expenses from the Consolidated Statements and from Operation Model. Those in the columns R&D and G&A differ almost tenfold. Ignore R&D and look at administrative costs (G&A). The direct costs account for only $200 million, while the entire operation costs are over $2 billion.
Uber has 715,000 m² of real estate. Nearly a third of its headquarters in San Francisco. In total, 22 263 people work for the company, but the G&A expenses only account for 2993 employees. Now think of all the monetary “biscuits” Dara and all the top-managers receive,… as well as the cost of renting in California.
All this, like many other things, is not associated with direct costs and, therefore, with the contribution profit. However, it is more important for us to understand that the margin will not cover them. And in general, the contribution margin at 8% is negligible. In Facebook, for example, the operating margin in the last report was at 42%.
But we have completely forgotten about interest expenses or loan payments. After all, Uber scored $17 billion in liabilities (!), and in 2018 interest expenses amounted to $648 million. Add this to the rest of the costs, and the Uber margin turns into a big, fat negative value. The contribution margin should be at least at 30% for Uber to the fence over the zero.
So, initially, we were interested in the break-even point. Look at the current contribution margin. How do you like that?

Page 104 of the prospectus
The least significant margin for assessing the sustainability of the company in the last quarter was negative again. This venture empire has existed for ten years, but the business model is still lame! And all this despite the fact that they manipulate this indicator. Even the artificially boosted contribution margin will be negative anyway!
«Core Platform Contribution Margin will decline during periods of increased investment. We expect the Core Platform Contribution Margin to remain negative in the near term due to various factors, including competition and planned investments in Uber Eats.»
The periods of increased investment activity seem to be almost too regular. The dynamics recently does not fit the expenditure. Costs are increasing, and revenue growth is slowing down. All despite the fact that the net profit is not even on the horizon yet.

Page 106 of the prospectus
The average order value decreased. The number of trips per user has not increased for the third quarter in a row. The increase in the number of trips is also slowing down (in absolute terms). I was most surprised that Uber is growing and expanding, and 23% of its cab-revenue comes from just five cities: Los Angeles, New York, San Francisco, London, and Sao Paulo. By the way, on page 38 there is another remarkable number — 15% of the revenue from a cab-service is generated by trips starting or ending at the airport.
End of the Line
Uber is mostly unprofitable. It is not only offering an attractive price but also provides a high-quality service. It costs too much money, the vast majority of which is spent to retain the necessary number of drivers.
With a declared commission of 25%, drivers (after all tax deductions) often receive less than 50%, instead of 75%. That is not enough. Short distance trips are particularly disadvantageous, and the average check dipped to $10. And keep in mind that about 60% of the revenue comes from the United States and Canada. Therefore, Uber has to allocate additional funds to sustain drivers.

Take a look at it again, $37.3 billion in payments to drivers make up 74.8% of gross booking. In theory, this should have been enough, but Uber gives them $1.7 billion in bonuses, plus another $1 billion in additional rewards. And we still do not know for sure how much money is spent to hire new drivers.
It was not a random number — 25% fee. Now it’s 20%. The difference in the gross booking is huge — almost $2.5 billion.
How is it that driver payments are listed at 75%, and drivers say it’s less? Notice the word “discounts” in the deduction column of gross booking. Discounts and promotions in the structure of all orders — a date shrouded in mystery because there is no info on its volume. Nowhere, among hundreds of pages of the prospectus. But I still managed to dig something up.
«Sales and marketing expenses increased by $ 930 million, or 58%, from 2016 to 2017.
Sales and marketing expenses increased by $ 627 million, or 25%, from 2017 to 2018. This increase was primarily due to increased consumer discounts, promotions, refunds, and credits.»
We do not know what is the share of discounts in gross booking, but if Uber is experiencing serious problems with taxi driver turnover, this share is so great, extra billions of dollars in additional payments would not be enough. However, our venture colossus does not stop dumping prices lower and over the past two years has recorded hundreds of more millions ($) of expenses for promotional offers into sales and marketing expenses. What is this redistribution for?
«And surely discounts are in the structure of all orders, but it is better to increase expenses than show investors less revenue. A kind of growth-fetish.»
But it is even more dramatic with Uber Eats. This is the fastest growing segment, but it does not have a specific operating activities chart. I managed to gather the necessary information piece by piece from pages 102, 103 and F-31. Revenue from food delivery in 2018 was $1.460 billion. Adjusted revenue (reduced by additional bonuses to drivers) — $0.757 billion. So this adjusted amount is the actual revenue.
The share of Uber Eats in the gross booking is $7.919 billion. So, after all the payments to drivers, the company receives 9.5% of order value from this segment instead of the stated 25%. Moreover, the adjusted revenue of Uber Eats has been decreasing in recent quarters, although revenues grow by hundreds of percent annually. This means that additional bonuses to people who are engaged in delivery increase.

Page 103 of the prospectus
I said the core platform’s adjusted net income or corrected revenue is actual revenue. Someone, probably, will reproach me: “why in the hell do you even think it is?!”. Their adjustments include bonuses allocated to the cost of revenue and referral fees from sales and marketing. But if you compare these general operating expenses, you will see that more than 90% of the adjustments are bonuses. Therefore, сore platform adjusted net revenue is the actual revenue.
Throughout my research, I looked for an example for comparison. It is very difficult to really compare Uber and Lyft or Uber and Yandex.Taxi due to the limited data in possession. But Uber Eats and GrubHub are similar enough. GrubHub revenue from 2017 to 2018 increased by 47.4%. Uber Eats (over the same period) showed an increase in actual revenue of 106.2%. The share of the revenue from the total value of orders in GrubHub was 19.9%, in Uber Eats — 9.5%.
However, GrubHub remains profitable with its growth. I wanted to look at the marginality of the business in the gross booking section, and I got a value of 1.5%. So the net profit is 1.5% and revenue from the total value of orders is 19.9%. Uber Eats is exploring and developing in a new niche (for Uber) with a gross booking share of 9.5%. If GrubHub had redistributed the costs for the purpose of large-scale growth like Uber Eats, it would take them almost seven annual net profits to recoup one year of such investments.
Understand What I’m Getting At?
Even after the IPO Uber will not have enough money to fix it all. Yes, there’s a huge network, Uber has tons of active vehicles, but… the competitive advantage is interest. The business of aggregators is low-margin by itself.
The food segment is only a fraction, but it is the fastest growing segment. Its share of the total amount of orders already exceeds 15%. Do you still think that Uber will pull this off? Remember the contribution margin and the success of the business model itself.
The only salvation for Uber is a fully operational “army” of drones. But I very much doubt that they have enough money to last long enough to reach that point, and even more so to buy tens of thousands of such devices. It’s more likely that one day I will be able to order Yandex.Taxi in San Francisco.
Stay tuned for more.