Tableau Aggregated Reviews
Tableau 01
Their interface was also not as good as Tableau for ad-hoc analytics. It’s quite hard to beat Tableau at that.
source
Tableau 03
In my opinion you are really short-changing Tableau. It does give you the capability to create great-looking visuals but it has very deep analytics capabilities too. It also has the ability to build a semantic model for your data. It has both live connectivity so you can point directly at your SQL warehouse and an in-memory engine that allows you to load data in.
Data doesn’t need to be de-normalized, but it does need to be pretty clean. It comes with a Tableau Prep product to help you clean the data if you need that. Most of the products on the list you linked have some sort of ETL capability.
Some people on here have said that it has a high-learning curve, I would say that the “first hour” learning curve is probably steeper than other products, but once you have basic understanding of how it works it is MUCH more intuitive than other products. It just has so many capabilities that you’ll find a lot of things that you have to dig into scripting / workarounds with other products are just part of the interface.
Anyway, that’s my opinion – I obviously have a preference but I think you should try Tableau and probably a couple other products that look good to you and see which one you like the best.
source
Tableau 04
Another thing I would like to mention is that tools like Tableau get a lot of sales based on the wow factor (often by going around IT). However when it comes down to it, many of the fancy visualisations are not that good at conveying actual useful information or are only good for a one off. So in practice it usually comes back to the good old line, column and pie charts, and tables.
source
Tableau 05
Tableau is great at the visual layer, but it’s not very intuitive to use without training up, and no one has time to put together snazzily animated visualizations/stories. Not a fit at the enterprise level for us, but I’m sure a few seats will be purchased eventually to make external presentations.
source
Tableau 06
Tableau is a fantastic tool if the use case is right. I would argue that there are very few organizations that have completely moved into the predictive and prescriptive realm in which visualization and data storytelling will not add value – especially if combined with Tableau Server and the capability to easily share information and insight. At my company we find that Tableau is a great solution to pair with more traditional upstream data science software and processes that creates more of a “product” for business users that is easy to use and understand. It keeps us from needing web infrastructure to share insight, recommendations and alerts for supply chain related data science and analytics.
source
Tableau 07
I hate Tableau. It occupies a dark place in my heart reserved for the likes of SAS and SPSS. It’s great for 80% of things, but the other 20% will shoot you in the foot. You’ll need to find hacks that work for exactly one thing and nothing else. Tableau does a lot of really stupid things that make it really easy to present bad data. For example, I recently had to fit a moving average on top of the original trend. Here’s what that was like:
– Add variable to shelf, do a bunch of Googling to figure out how to add a moving average, put moving average on.
– Oh wait I need a dual y axis. As in something that almost no serious data visualization professional would ever use. Meh fine I’ll do it.
– Wait this is weird. Why is the moving average always above the original trend? Is that a weird feature of moving averages I haven’t thought about? It’s been a long time since I’ve used them. Damn it’s weird it took me a bit to notice this. I almost reported these numbers!
– Oh wait now I see it. After staring at this for an hour, I need to click “Synchronize axes” because the real trend and the moving average are on different scales. This is why dual axes are terrible.
– Oh wait, synchronize axes is greyed out. Why is this? After a long troubleshooting session, it turns out it’s because the original variable I’m smoothing is a count so it’s an integer, not a float, while the moving average is a float. I change my counts to floats and now I can synchronize things.
– I remove the labels for the second y-axis. This, atypically for Tableau, is really easy.
– Why do my tooltips look weird? Oh yeah, converting counts to decimals means that my counts now have .0 next to them. I have to go manually change number formats.
Doing anything other than a basic chart is enough to give you an aneurysm. Tableau is one of the worst pieces of software in terms of UI and and ease of shooting yourself in the foot that I’ve ever seen. My company loathes it. The only reason to use Tableau is that in the business analytics market, there isn’t anything better. We tried a few other solutions and they sucked more. If it wasn’t for the fact that we want non-programmers to be able to make dashboards, I’d do everything in ggplot2 in a heartbeat.
source
Tableau 08
My department has enforced the use of tableau for all reporting and we’ve been using it daily for about a year. My opinion on it is that the reports you can create are loved by the people who receive them because they are so interactive and can show varying levels of detail. However the people who have to create the reports are constantly frustrated by the software along a similar line to what coffeecoffeecoffee already said – it’s the only piece of software I’ve used that makes things more difficult than it needs to be rather than easier. We also had a Tableau consultant come in and rather than teach us any consistent explantation of how to get what we want out of it he just spent the whole time trying to figure out individual workarounds for each problem. You basically have to trick tableau into doing want you want rather than just asking for it. Also I see it as a reporting tool, not data cleansing or analysis.
source
Tableau 09
Not the hugest fan, but there is more and more demand from clients to produce using tableau. They like the idea of a web-based dashboard that includes real-time or regularly updated data with easy to interpret visualizations.
There are also points of contention between me and some of my colleagues. Some colleagues swear that data visualization is better in Tableau than R. Comes down to taste and preference I guess.
source
Tableau 10
Tableau is the de facto Enterprise visualization standard …. That may mean the company’s it Department is not comfortable with you producing your own visualizations, and wants these nice Tableau dashboards
source
Tableau 11
Tableau is a good skill to have regardless of your roll in the data lifecycle. With the Python and R integration data scientists can open up their models to be used within data visualization. This fills the gap in Tableau’s analytical capabilities for the most part. Depending on your org, leadership might like seeing reports on Tableau server. So, learning the tool isn’t a bad idea.
source
Tableau 12
As a data scientist, Tableau is good to know when it’s not your responsibility. You can use it to do descriptive analysis or deploy your models in a visualized form… But if you’re responsible for it you’re going to be doing more business intelligence type work and pulling reports. Which is fine if that’s what you’re into but it’s not data science.
source
Tableau 13
I’m currently using Tableau. It’s terrible. There are so many times when I want to do some basic thing and all I find online is “here’s an unintuitive, hacky way to do this.” I’m only using it because business people like Tableau. Even the PM I’m giving deliverables to hates Tableau because everything is so hacky and would switch to a better alternative in a heartbeat, if one existed. I’d much rather use Shiny or ggplot2 for visualizations. The company seems to have no idea how to design a good UI. There are so many things that should be straightforward features but aren’t, such as:
– I have data with a “Subtotal A” and a “Subtotal B” column and want a stacked bar chart for “Subtotal.” I have to reshape my data outside of Tableau to get a “Subtotal” and a “Subtotal Type” column to do this. God forbid I want one slider for the data with the two subtotal columns and one slider for the data without the two subtotal columns.
– I want to put very light shading onto an upper set of bars. Not allowed because it’s “chart junk”, but sure, let me add a second vertical axis.
– No out-of-the-box support for Pareto charts.
– Pointless features that very few people want, but are a pain to disable. I’m looking at you, “Show selections.”
– WHY IS THERE NO EASY WAY TO MAKE A SANKEY DIAGRAM? Seriously. This is a chart type that tons of people use to visualize dropoff at stages, yet Tableau has no default implementation and I have to use obnoxious hacks like this.
– Timestamps silently truncate milliseconds. This is annoying when we’re visualizing API calls that occur within fractions of a second. It’s even more annoying when we almost send data to a client and have no idea Tableau does this by default.
– No way to embed a spreadsheet with a “Click me to download!” button. There’s an undocumented feature where you can download the first sheet in a dashboard, but it seems insecure and hacky. Plus what if I want people to be able to download either sheet?
– It’s been god knows how long and the “Cannot remove time from date filter” bug is still a problem. This link says it’s been an issue since 2012.. And the only advice Tableau gives on fixing it is try doing the same thing again. Ignoring a major bug for five years is terrible for a piece of enterprise software that charges what Tableau does.
– I have “Range of Dates” specified, but want the right endpoint on the slider to be today’s date. There is currently no easy way to do this because if I update the data online, it defaults to the most recent date for when I uploaded the dashboard. So if I have date that goes until January 24, the right side of the slider will stay at January 24 even as the data refreshes so that the most recent date is January 29. This is absurd, and no one has added the option do this even though it’s been an issue for seven years.
– There is no way to have a single checkbox for a boolean variable. Clearly no one in the history of interactive data visualization has ever wanted to be able to check a box next to “Include subset?”
– Tableau Online is incredibly slow. We’re having to pre-aggregate data because a basic dashboard is taking 20 seconds to load.
– No easy way to replace a dataset in just one sheet. If I want to close Dataset A, I have to close it everywhere and lose my work. It means if I want to, let’s say, use aggregated data and replace variables with their aggregated versions, I have to remake the entire dashboard.
The only benefits to using Tableau for us are pretty graphics and differentiated permissions, which helps because we often have clients at different companies who we don’t want to see each others’ data.
source
Tableau 14
Tableau is a good skill to have on your resume, but in practice there are lots of other pieces of software that can do the job, so it’s going to come down to personal/professional preference. Some options are even free (but not necessarily out-of-the-box production ready).
source
Tableau 15
I use Tableau to explore data and prototype visualisations, because its drag-and-drop interface, table calculations, and support for calculated fields makes my life a lot easier. If it doesn’t need to go any further, I can screenshot the result and drop it into a report. But anything promising, or that needs to be repeatable/live, gets migrated into another tool like D3.
If you want to put together a dashboard where non-analyst users can keep on top of data without you being a bottleneck, you’d probably have more use for Tableau.
source
Tableau 16
Tableau is one of the go to tools for visualization in practice from my work experience. As mentioned by someone else, other tools can do the trick. If you’re in school, take advantage of the school’s license. If you’re doing it for work, get the license and leverage it. Many tools have easily transferable skills, so if you don’t go with Tableau now, you will be able to jump into it with a decreased learning curve due to practice with another application.
source
Tableau 17
This is the sole reason i love working with Tableau. It allows me to build some self service dashboards for the rest of the company to get to their data and answer their own day to day business questions.
source
Tableau 18
This is exactly how I feel about Tableau. Great tool for communication but poor tool for exploration.
source
Tableau 19
By the number of times I curse at Tableau in my regular workweek, you’d assume that I hate the damn thing, but it really is a pretty incredible piece of software for one specific (but absolutely enormous) thing: communicating stuff to the rest of the company.
I would never use Tableau for exploratory analysis, nor would I ever use it to explain something to a fellow analyst. But for showing things to sales or marketing? It’s fantastic. It’s a great tool for giving database-esque access to non-tech people so they can monitor things, and it works really well in terms of letting people export data from dashboards so they stop coming to me with requests.
source
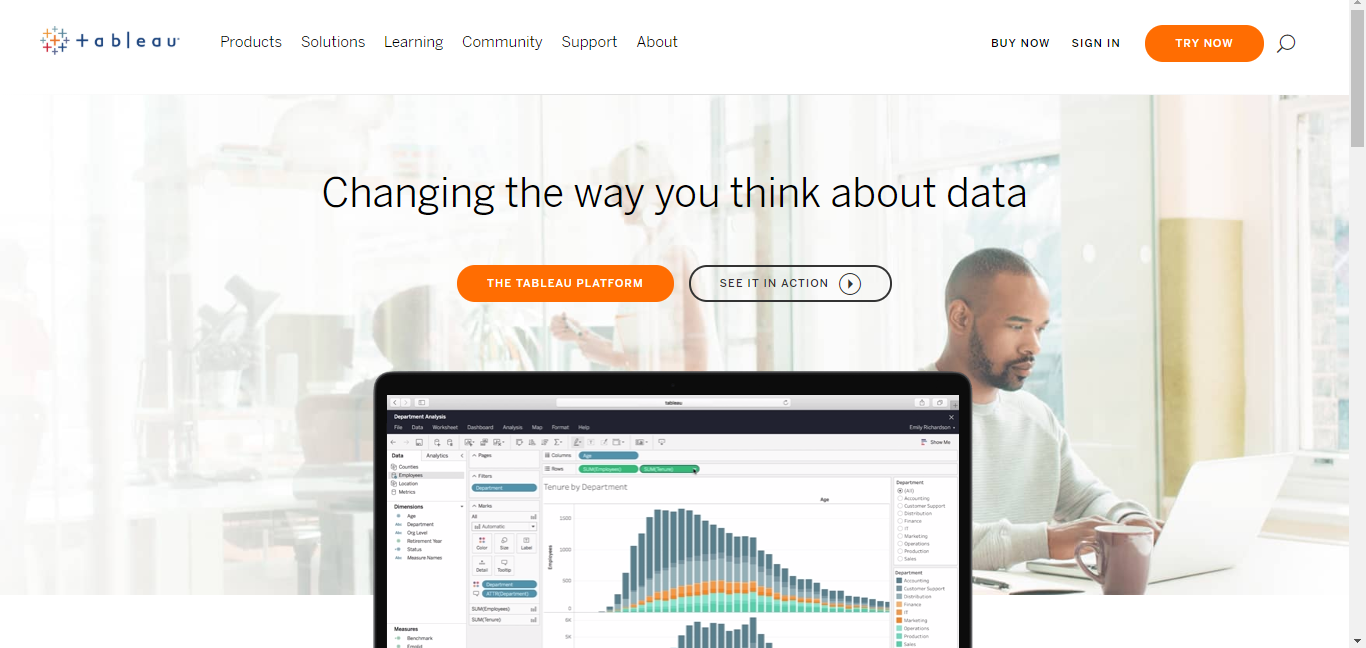
Sneak peek
Home page
Footer
What’s inside
1
2
Changelog – pre-ecosystem era
v0.1.8 Hound @ apps.the.gt – b2b prospecting platform
v0.1.8.1 Business directory – content experiment to support b2b prospecting platform.
v0.1.7 White label agency solution, including white label lead generation & link building
v0.1.6 GRIN tech affiliate program is live.
v0.1.5.3 GRIN jobs experiment started
v0.1.5.2 Working on cool in-house lead gen project - Art Director is preparing 100 picks of Business Cards in various niches.
v0.1.5.1
GRIN games emerged
As a web agency we never could and never will be able to escape the urge of building things.
Among million other things we played with an idea of text-based games and the last piece that was missing
was the story itself. So via in-house outreach platform we found two
established writers that believed in the project and agreed to participate.
Shout out to Richard Abbott who wrote Fraud on Thetis and Eva Pohler who sent us a huge draft we are still reading through.
v0.1.4
GRIN launcher is born.
It is an outreach platform that we use to establish connections with editorial teams.
They say samples of published articles look good
but pricing looks even better
At some point we realised that list building, fetching contact details & outreach tech work just as well for b2b lead generation
v0.1.3
Once, we fell in love with ecommerce, because of short feedback cycles on marketing & development efforts.
Today we ship into production
inhouse SaaS project - AVOKADO - the web
app for learning languages with flash cards.
The year after we built it we realised how long is the road map ahead & what resources we'd need to promote it and decided to put it on hold.
One day as we ship GRIN tech v3.0 into production we'll distrupt the language learning market with Avokado.
We love Wordpress and recently shipped two plugins into open beta for commercial sale.
v0.1.2.2 King The Monk - wordpress plugin to virally grow your email list
v0.1.2.1 Plain Conversions - wordpress plugin to convert your visitors
v0.1.1. Expanded core offering to visual productions
v0.1
It's Autumn 2017 and GRIN tech agency's website is born.
We have it saved for the history.
Boring things: Privacy Policy