List of e-commerce metrics as such is enormous, because its online commerce you can measure almost everything: from the number of likes on your Facebook page to the Lifetime Value of each client segment. Technically, all of those are metrics. Calculating and analyzing metrics consumes resources, but it is essential to understand that not all metrics are vital to an online store.
An online store has its primary goal of making a profit: attracting more customers, increasing conversions, decreasing logistics costs and staff salaries.
Everything a store does should target an increase in profits — even creating an Instagram account. The reputation is another critical aspect: establishing friendly communication with customers is good, but if no one buys your product there is something wrong with your “friendly communication.”
Outline
Vanity metrics that are not worth your time
That is a reasonably large group of metrics with a particular distinguishing feature: their numbers look impressive, but in reality they are meaningless. It’s an illusion, Neo.
These metrics are just a waste of time for your store, so you better know them to identify the “garbage” indicators quickly:
The volume metrics
These metrics look like “1000 people on the staff”, “20K subscribers on Twitter”, “email contacts database at 1.5M”, “5000 unique visitors per day”. But the point is that 5,000 individuals are not 5000 buyers, as well as 20K subscribers.
Get rid of a metric that fuels your ego and says nothing about the actual effectiveness of your business.
Average time spent on the page, the total time spent on the site, the average number of pages viewed per session, etc.
Many articles include these metrics onto the vanity metrics list but not without exceptions. Let’s take a board game store as an example: the time spent on the site shows that people are interested in these games, they browse the catalog, they carefully read descriptions and instructions and probably plan to make a choice.
The purpose of an online store is to satisfy the client’s needs as quickly as possible. That is why the store has smart filters, product recommendations, intelligent search engine, and other technical bells and whistles, which even the most giant offline hypermarket can not boast.
Time-related (duration) indicators are undoubtedly crucial for content projects like an online cinema or a blog. The more time the visitor spends there, the better it is for such sites. An online store has a different set of goals like a service/product delivery made fast and easy.
Metrics of “love and adoration.”
These include likes, reposts, appreciation letters received by your store and the likes of that. It all plays with your pride and even raises the morale of the team. To be accurate, the effect of this real morale boost cannot be estimated in money and just by itself holds quite some value for the business.
But what the situation is like in the long run? Hundreds of comments under your blog entry may bring you additional active customers, but it will be impossible to track the correlation between actual purchases and these very comments. So, the lesson about these metrics is: feel free to improve them, but do not measure or analyze.
Micro-conversions to be taken into account
So, with vanity metrics sorted out here comes another group.
Micro conversions do not represent the effect of an action in monetary value, but carry specific informational value to themselves (and can provide analytics coverage of much bigger user group).
Such metrics, for example, are:
- The percentage of letters on your mailing list that are opened/read.
- The percentage of clicks on the banner ad.
- The number of transitions via a Facebook ad campaign.
- The number of orders on your site over a specified period.
Such indicators do not show whether the mailing or advertising was efficient in terms of sales. They only indicate whether the actual email delivery or advertising campaign was effective to guarantee quality traffic for your website.
These metrics are vital for actual contractors/service providers and are as crucial as macro-conversions, especially in industries with a long feedback loop. For example: in elite real estate a sold penthouse is a part of macro-conversion, and micro-conversion includes calls and arrangements of viewing dates. That makes monitoring the effectiveness of marketing campaigns a much more convenient process. Here is a more in-depth overview: Micro conversions – scale analytics user coverage from 1% to 100%.
E-commerce metrics that matter: macro-conversions
Intermediate metrics allow you to locate the growth points of individual elements and stages of the sales funnel. However, it’s the final metrics that help to see the real picture. It is especially important for top management and business owners. At the end of the day, a large client base is worthless for your cozy bootstrap business if the economy does not converge.
Below you can see a list of metrics and a summary table at the end, which also offers suggestions on how to improve those metrics.
The average revenue per user (ARPU) and per paying user (ARPPU)
ARPU helps to estimate how much money each user brought to the site provides. It is pretty simple: you choose a planned profit, then determine how many visitors you need to attract to reach the profit.
It is worth mentioning tests that can help to increase your conversion. Along with A/B tests (which button is pressed more often — green or red?), there are also A/A tests, which measure the effectiveness of different attraction channels. A/A tests tell you who presses the button more often — users redirected from social networks or contextual advertising?
ARPPU gives an understanding of how effective your work with existing customers is. You must use remarketing, loyalty programs, personalized mailings to improve ARPPU. Use any tools that will help you get extra purchases from your current customer.
These two metrics are the basis of marketing for the online store.
Total order value
If total order value falls low or lower, you can increase it in several ways:
- Increase the number of orders (e.g., by purchasing additional traffic).
- Increase the average order value (e.g., through personalized product recommendations).
- Motivate customers with service (e.g., offer special favorable terms of delivery or a bonus gift for a higher value order).
Average order value (AOV)
AOV is another critical metric. You should divide the total revenue by the total number of orders over a certain period to calculate it.
The average order value (AOV) is the ratio of the total order value (e.g., the received income) to the total number of orders over a while.
Understanding how much money each order brings helps you make necessary adjustments to your development strategy. Paired with the values of traffic and conversions, the AOV metric allows you to predict the revenue of an online store.
How to increase AOV
You can use the following offers:
- Cross-sell
- Up-sell
- Offer free delivery for higher value orders
- Provide discounts for customers buying more than one copy of the goods, etc.
Offering customers accompanying goods or accessories on the check out page is bound to have a favorable effect on the average order value.
Unit-economy of a single order
To keep track of your dynamics, it is necessary to monitor the following metrics for each channel of traffic daily. Let’s see:
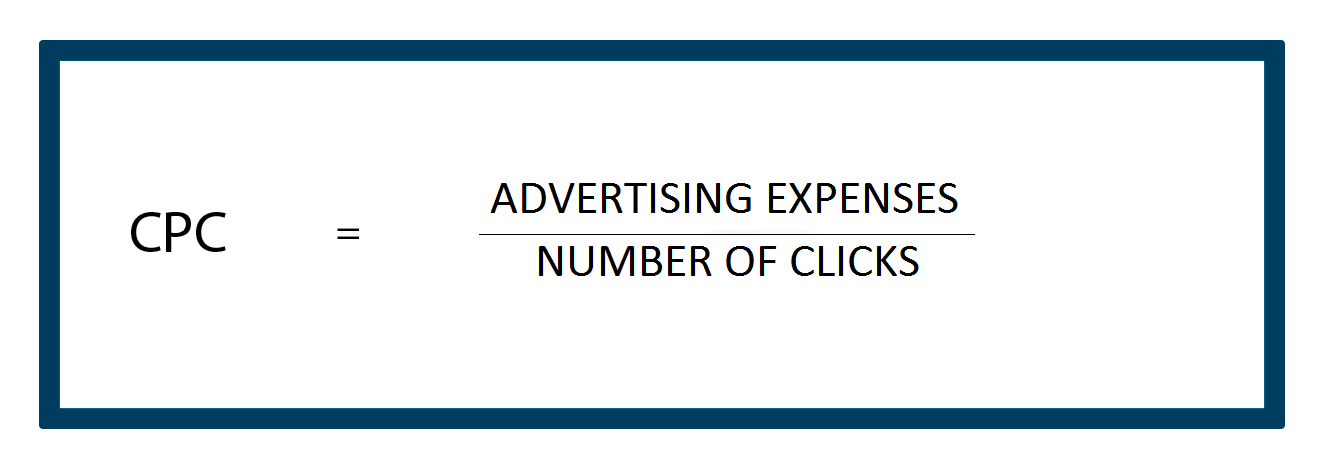
Cost Per Click (CPC)
Cost Per Click — the ratio of the money that the online store spends on advertising (through search engines, online publications, relevant websites, and other resources) to the number of clicks this advertisement generates. That is how much money a single visitor redirected by adverts costs your store.
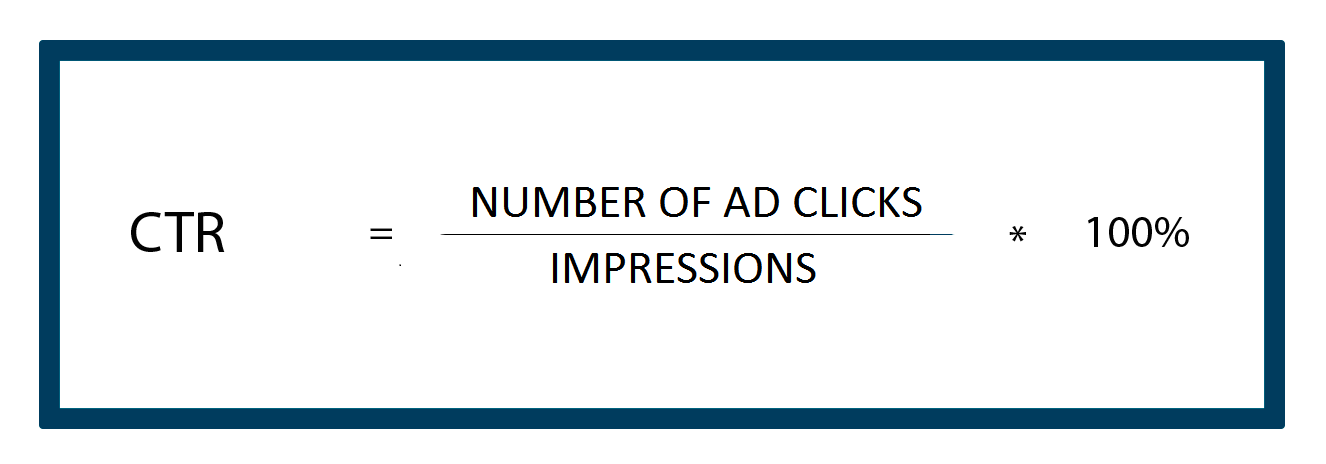
Click Through Rate (CTR)
Click Through Rate — the ratio of the number of clicks on advertisements to the number of their impressions. This metric helps determine the effectiveness of an advertising platform, the efficiency of the advertising campaign in general, as well as the effectiveness of individual advertisements.
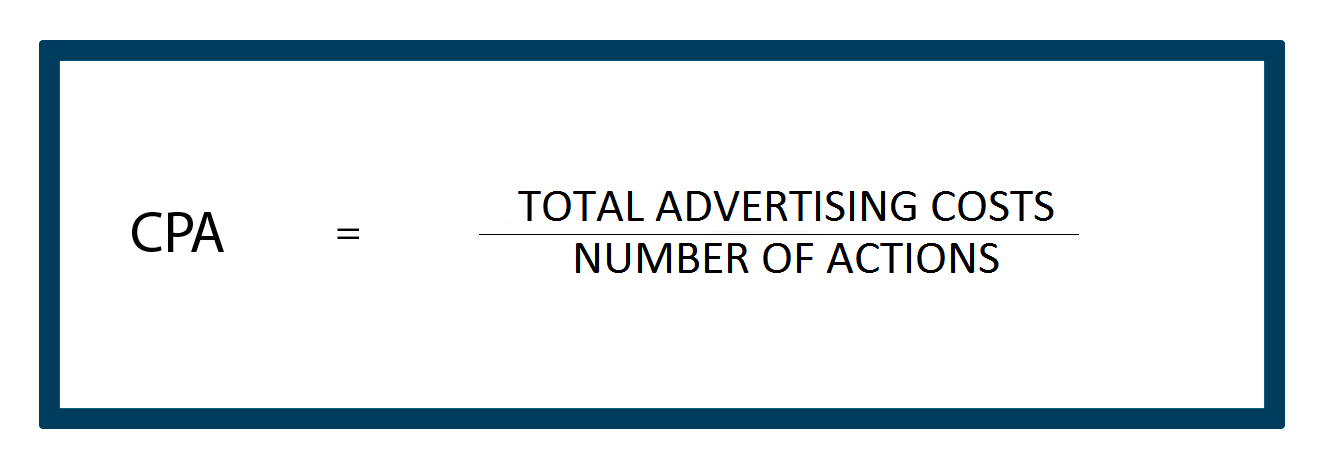
Cost Per Action (CPA)
Cost Per Action — the cost of a target action of a visitor on the site. The target action can be registration on the website, subscription to the newsletter, adding a product to cart, etc. CPA is one of the most cost-effective models of advertising, as the advertiser pays only for a particular user action.
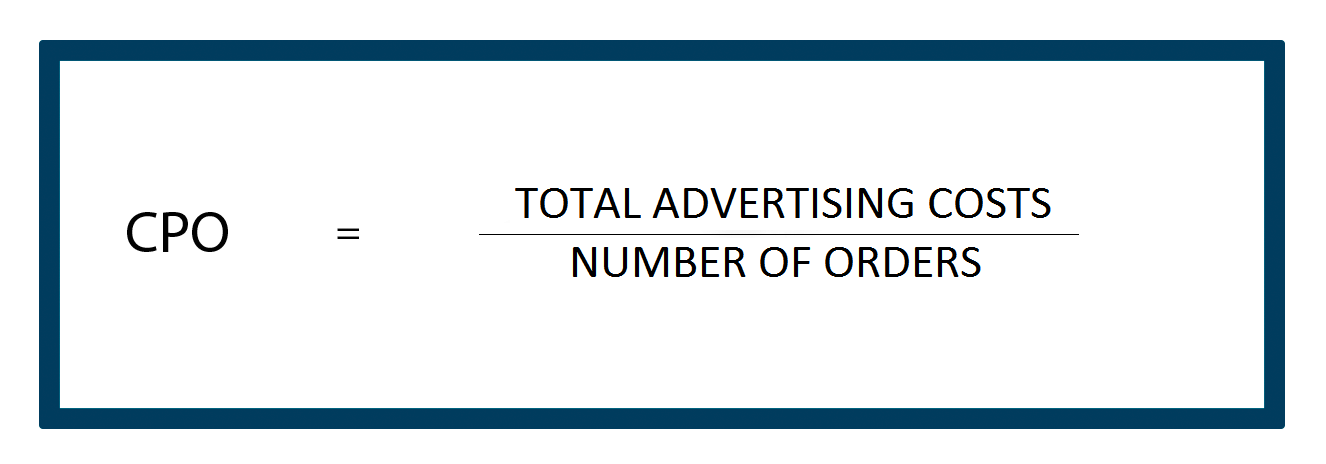
Cost Per Order (CPO)
Cost Per Order — the ratio of advertising costs (or costs of any marketing activity) to the number of orders received. In contrast to the CPA metrics, the only target action here is a purchase.
That is one of the most critical metrics in eCommerce and online business, as it helps to understand the cost of one order through different channels. Low CPO indicates high advertising performance.
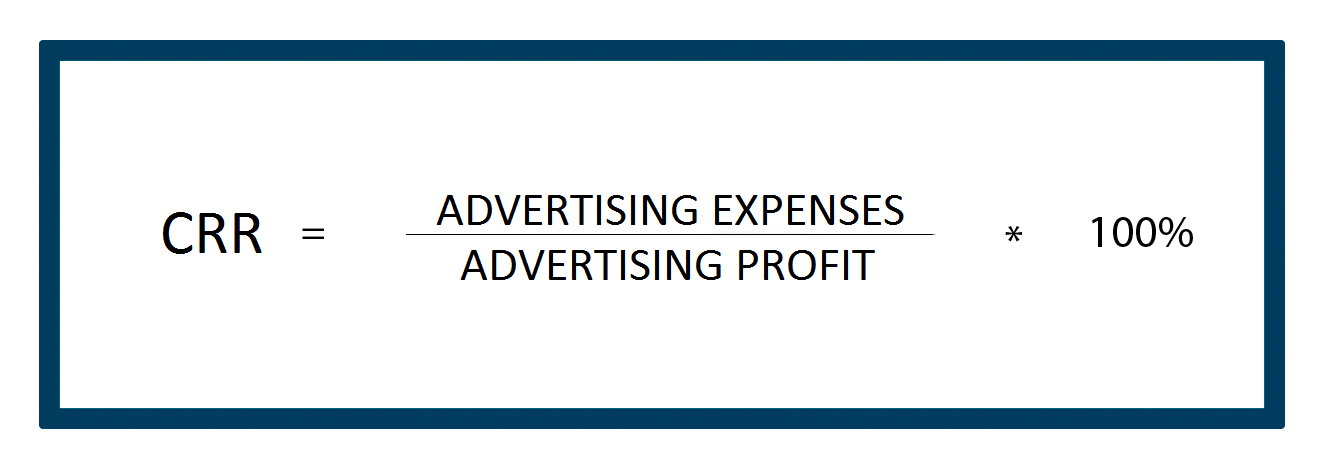
Cost Revenue Ratio (CRR)
Cost Revenue Ratio is a ratio of all advertising expenses to profit the advertising has brought. In that respect, this metric is similar to ROI and helps evaluate the effectiveness of advertising investments.
CRR depends on the final sales turnover and gives the most objective assessment of the advertising campaign.
The metrics we mentioned above should be monitored every day, but there are “long term” metrics that are important for making strategic decisions.
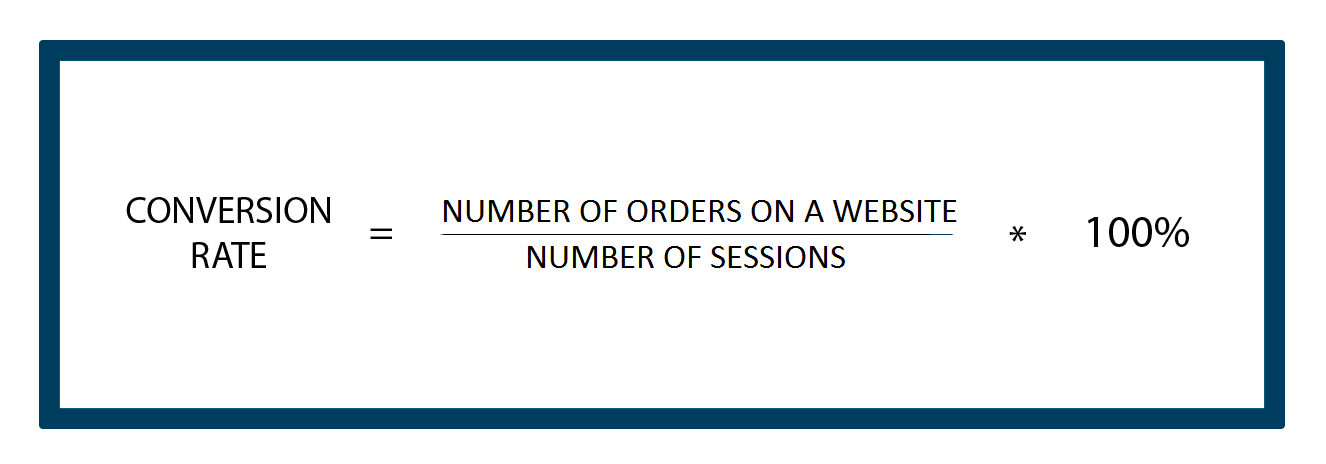
Conversion
Conversion Rate — shows a share of visitors (a percentage) that make a purchase. Another key indicator of an online store.
To get reliable CR data, you can segment the metric according to various criteria:
- Traffic sources
- Device types
- New and regular visitors
- Product groups (for online stores with a wide range)
- How to increase the conversion
- Conduct A/B tests on the site and in the mailings
- Create convenient navigation on the site
- Create additional filters to find the right product
You should continuously work on increasing the conversion just like Growth Hackers from Retail Rocket do it. For example, a thin iterative adjustment of the commodity recommendation blocks at the Toy.ru online store provided a 5% increase in conversion for the product page at the first stage, an increase 4.63% at the next step and a 3.3% increase at the last stage of testing.
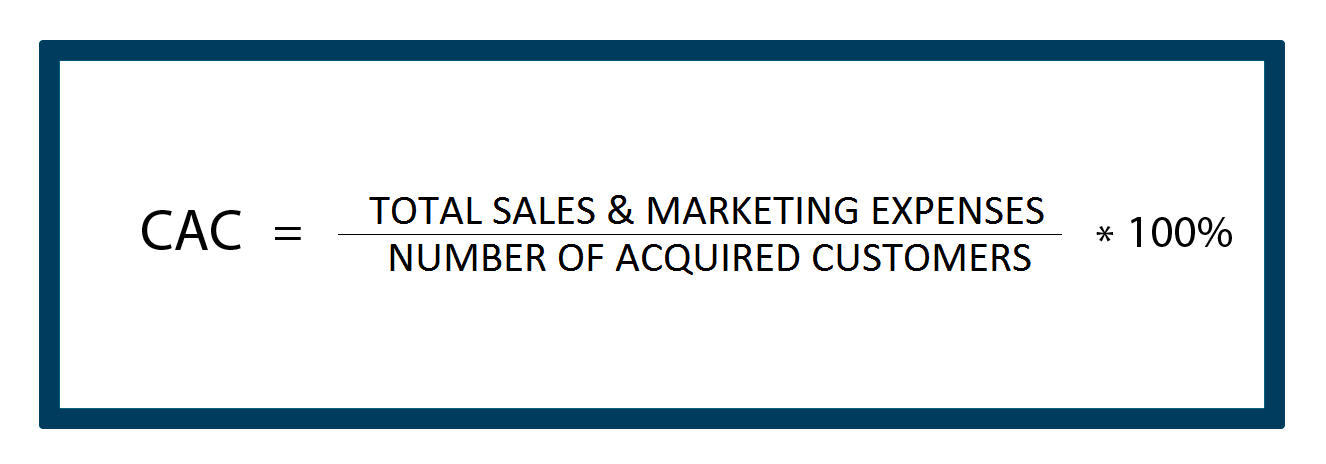
Customer Acquisition Cost (CAC)
Customer Acquisition Cost — the total marketing costs of attracting one new user. The cost of attracting a client includes the costs of all advertising channels and all the software involved in the process.
CAC is often confused with CPA (Cost Per Action) and CPO (Cost per Order), but these metrics refer to both new visitors and permanent ones, while CAC focuses the costs of attracting a new client exclusively.
The CAC formula is simple:
And here is a more detailed version of the formula:
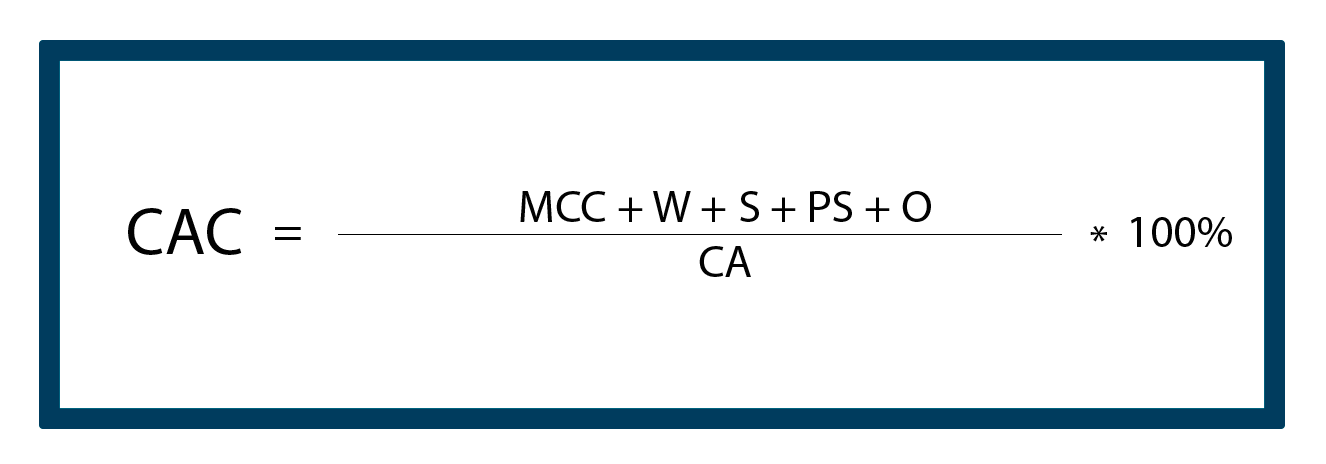
Where:
- MCC (marketing campaign costs) = The total amount of marketing expenses on attracting new customers (not keeping the current ones).
- W (wages) = Salaries of marketers and sales managers
- S (software) = Costs of advertising and sales software used (sales platform, marketing automation, A/B testing, analytics services, etc.)
- PS (professional services) = Costs of professional services provided to marketing and sales departments: like design, consulting, copywriting, etc.)
- O (other) = Overhead costs related to the marketing and sales departments
- CA (customers acquired) = Total number of acquired clients
The most important thing is to keep the ratio of LTV to CAC in favor of the first. A balance of 1:1 or less is going to make an online store lose on every customer acquired.
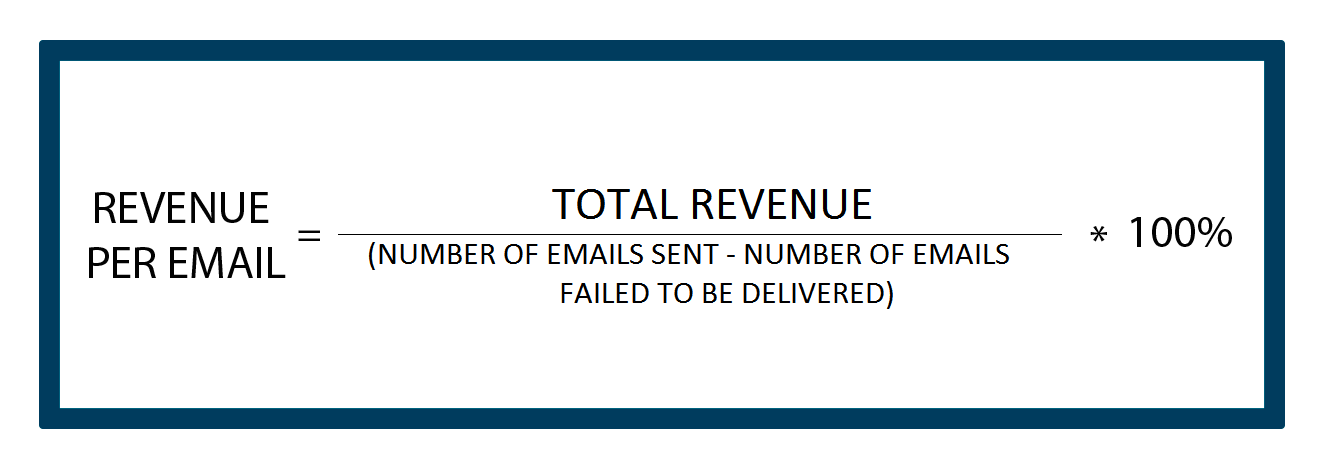
Revenue Per Email (RPE)
Revenue Per Email — a ratio (%) of income to each letter sent. It helps for a better understanding of how much profit can mailing lists bring and differentiate profit by letter types.
How to increase RPE
- Segment the subscriber base
- Use personal recommendations
And a few more metrics of significant value for your business.
Lifetime Value (LTV)
Lifetime Value indicates a total profit a client can bring over the course of your relationship. That is one of the most critical indicators. It helps in predicting the company’s profits and determining how much you can spend to attract a customer, so it still pays off.
Knowing LTV allows you to adjust your marketing strategy, redistribute budget to attract new customers, retain existing ones, identify and focus on the most valuable customers, etc.
There are a couple of formulas to calculate LTV:
- Simplified formula
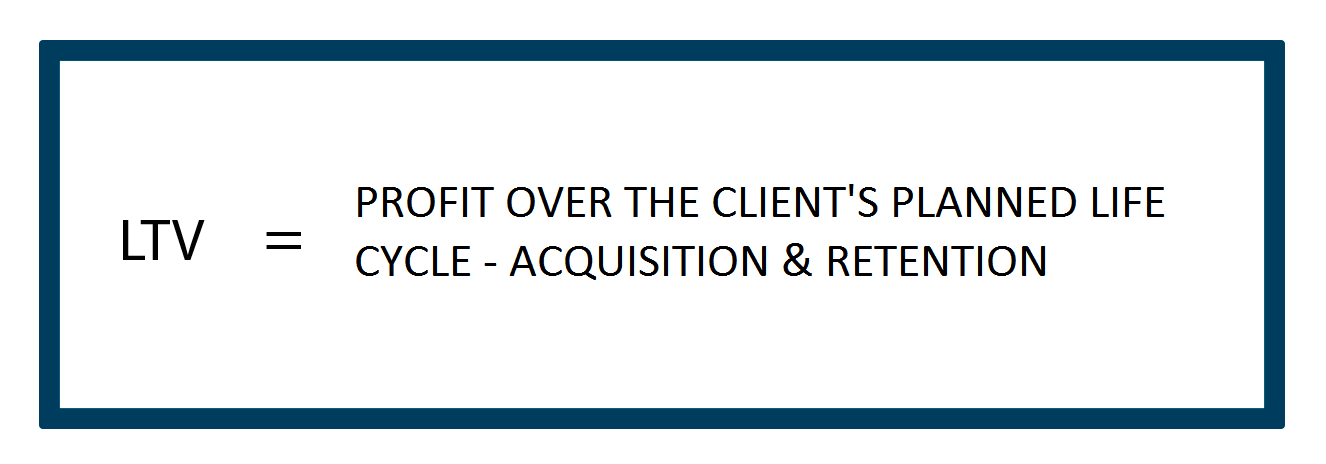
You need to know the revenue a customer generates, the cost of attracting and retaining a customer.
- Standard formula
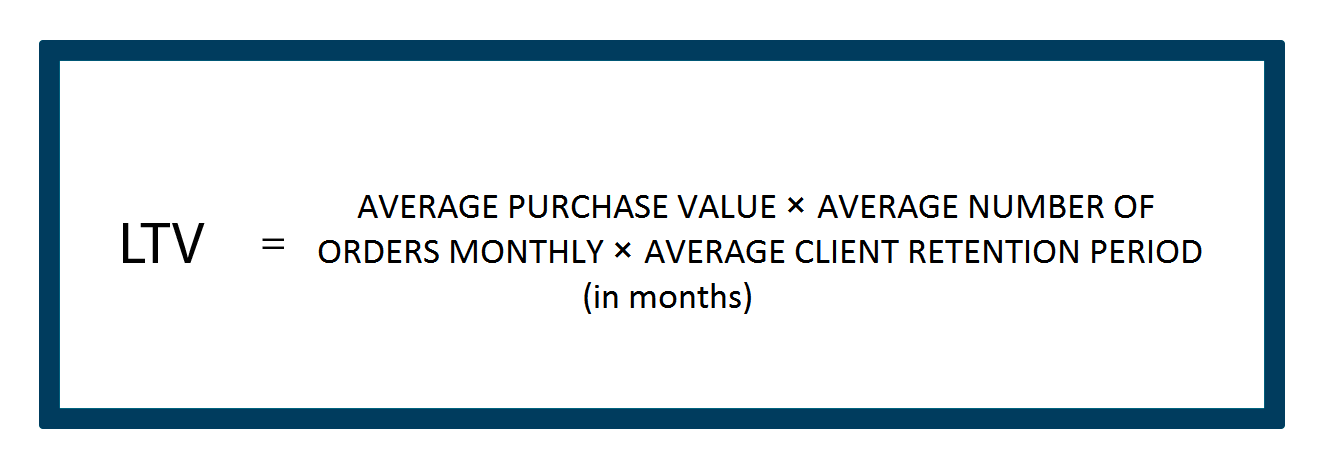
The formula is more precise, but since it is based on average values, it can be applied separately to different segments of customers or groups of products.
LTV is a critical metric, but also very difficult to measure for there are many channels for the customer to come through and not always do online stores have the ability to track all customer purchases. First of all, even the most “advanced” multi-channel loyalty programs do not exclude one-click orders or offline purchases without a loyalty card. And it is immediately followed by the fact that it is challenging to create a system to take all the purchases of a single person into aсcount. We are talking about a system to track all the possible channels — from a store shelf to a mobile application or a call center. Therefore, despite the significance of LTV for business, the metric is quite rarely used in practice.
How to increase LTV
There are three directions you need to work in: motivate customers to buy more, motivate customers to buy more often and motivate them to buy regularly. Thus necessary:
- to work on increasing the average purchase size
- to introduce the loyalty program
- to incentivize repeated purchases
One of the ways to induce a customer to re-purchase is a letter: inform the customer that all loyalty points will be lost soon (due to customer’s inactivity) and include a block of personal product recommendations. Interest and urgency triggers are likely to do the job.
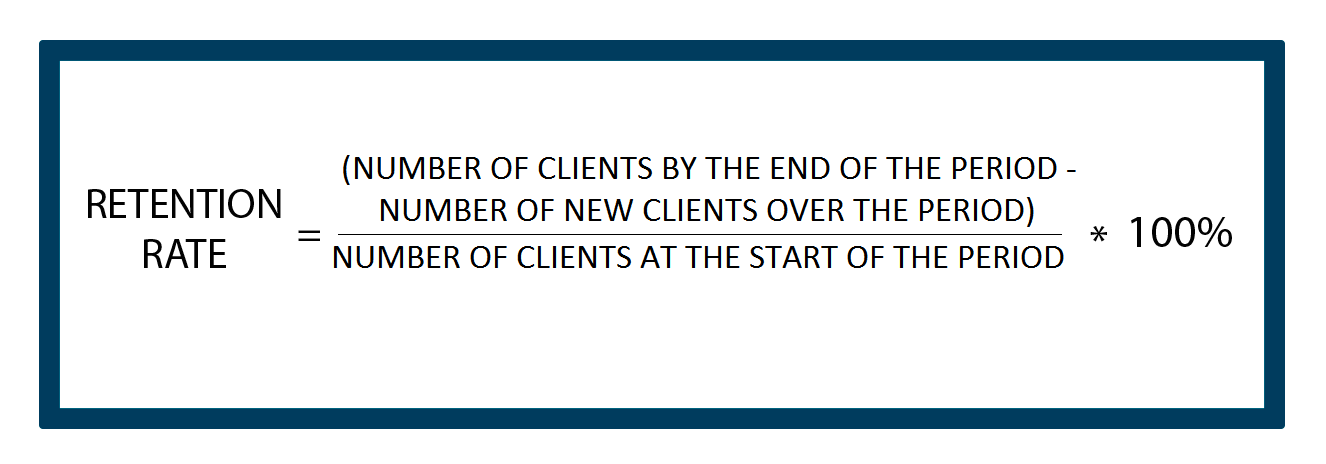
Retention Rate
Retaining a buyer is about seven times cheaper than attracting a new one, so it can be critical to focus your attention on customers who have already made a purchase.
How to increase Retention Rate:
- Provide quality service
- Invest in your brand
- Use rewards and loyalty programs
- Communicate with customers on a regular basis
The capabilities of predictive analytics help to form personal recommendations. Offer the goods customers most likely want to buy, perhaps as an addition to the previous purchase. For example, you can use the trigger scenarios of “Proposal of the next most likely purchase” or “Proposal of goods of repeated demand.”
Surely, you cannot set track of all critical metrics right away, but even if you manage to do so, you won’t have enough time to optimize each. That’s why it is essential to:
- automate everything that can be automated: email marketing, web push notifications, and newsletters, banner remarketing, cross-sale and upsale;
- not to waste your time on myriads of different tools: the more tools you have, the more time you spend to use them and analyze data.
| Metrics | Calculation | Description & improvement |
| Number of orders | Calculated and measured by analytical systems | The base indicator. Shows the number of orders made over the selected period. It is used to calculate other metrics and is of minor significance by itself.
How to improve: Increase traffic and conversion rates. |
| Total order value (TOV) | Number of orders × average order value (AOV) | Shows the monetary value of all goods purchased over the selected period.
There are two ways of improvement. 1. “Extensive” — by increasing the number of orders (by increasing the cost of attracting targeted traffic, remarketing, advertising mailings). 2. “Intensive” — by increasing the average order value via cross-sale/upsale/client motivation (e.g., cheaper/free delivery for customers with higher order value). |
| Revenue | Amount of goods sold × Price | One of the fundamental indicators. Used to calculating many others.
Can be improved via traffic and conversion rates increase. |
| Profit | Income – Expenses | The metric demonstrates the success of your business.
Increase traffic and conversion rates. Note: $10 of online payment now is sometimes more profitable than $12 the day after tomorrow during goods shipping. It all depends on how you approach accounting, logistics, what is the frequency of purchases, etc. |
| ROMI (Return of Marketing Investments) | (Income – Marketing costs) ÷ Marketing costs.
(%) |
ROMI > 0, for marketing, to pay off. It can indicate a marketing activity as a whole or within individual campaigns/channels.
Do not get fixated only on the outside aspects like targeting ads, improving ad content, etc. The inside elements like the content of landing pages, use of dynamic elements to change the site for each specific advertising channel are essential too. |
| CAC (Customer Acquisition Cost) | MCC ÷ CA
MCC — the total amount of all marketing expenses to attract customers CA — the total number of customers acquired |
The metric should be considered in conjunction with LTV. The less the CAC metric in comparison to LTV, the more profitable it is.
Divide channels into three groups: 1) Positive 2) Neutral — with a minimal difference from LTV 3) Negative — these should be shut down immediately. Concentrate on your efforts on the Neutral group instead. |
| LTV (Lifetime Value) or CLV (Customer Lifetime Value) | The money a single client brings over their “life cycle” – (Client acquisition costs + client retention costs) | The CAC to LTV ratio of 1:3 is considered to be perfect. If the LTV > 3 it makes sense to increase marketing expenses — your marketing is not operating at the peak of its potential. And if CAC > LTV, your marketing is detrimental.
Analyze your customer groups. Target the most numerous one. Determine how many orders per life cycle a single client makes (2, 3, 4, etc.). Implement client motivation as a part of a loyalty program, to make clients reach the desired number of orders. Think about special conditions you can propose to a group of clients with high loyalty, whose number of orders is average or above. On the other hand, implement reactivation programs/surveys for low loyalty groups. Strive to increase the average order value. |
| CR (Conversion Rate) | Number of targeted visits ÷ total amount of visits.
A targeted visit is the one that results in a purchase or any other measurable target action. |
One of the leading efficiency indicators. The higher its index, the better.
There’s a lot to it: from improving usability to discounting. Do not forget to use an individual approach for each traffic channel on your site. Try implementing discounts or special conditions for the service only a certain part of clients\ use greetings for the retargeting audience, etc. Increase your profit: 0 – no discount; 1 – with a discount; If (CR0 × Profit0 > CR1 × Profit1), then either decrease a discount or eliminate it. |
Here’s a link to our checklist to evaluate an online store effectiveness
To sum it up on e-commerce metrics
We went through three types of metrics: vanity, intermediate and final.
- Vanity metrics are not worth the attention of an online store. They only massage your ego with numbers.
- Intermediate metrics (micro-conversions) are essential to determine what stage of the sales funnel is halting your business. Once you find out, fix it. For example, if your letters are opened/read but you barely get any clicks, it means that the title is right, the timing is right, and writing drops the ball.
- E-commerce metrics (macro-conversions) are the most important for an online store. These metrics help you evaluate any marketing activity in money figures. Pay careful attention to these metrics.
TIP: even though we have digital marketing analytics solution we do not set up proper conversion tracking until first sale is made (just simple GA install that it).